Major changes in the health and care landscape present opportunities for charities to use data relationally: to broker partnerships, influence priorities and legitimise their knowledge
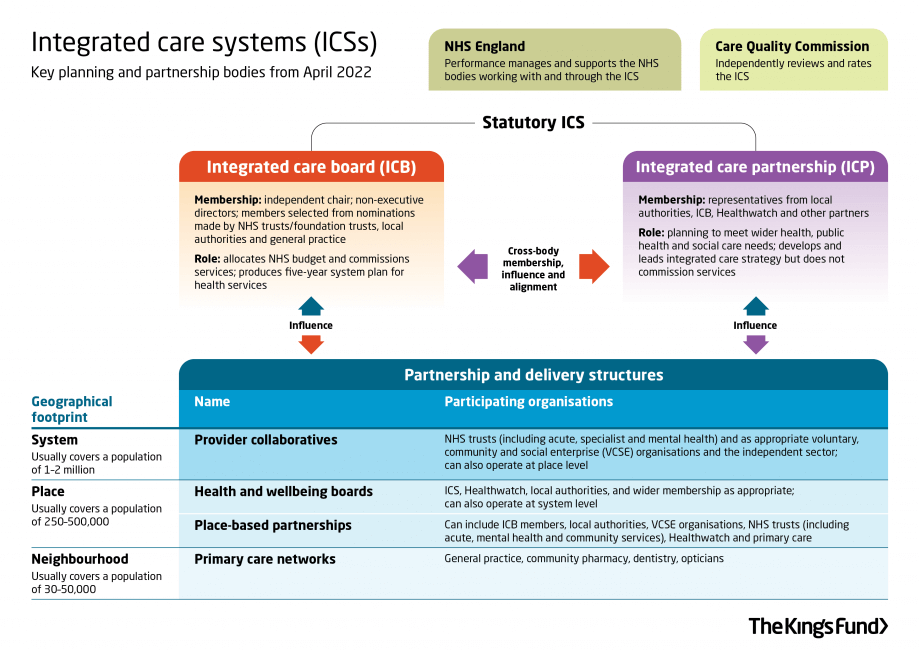
The Health and Care Bill (which will most likely become law in the summer of 2022) will formalise the shift to integrated care systems (ICSs) that has been taking place over the past few years. Integrated care systems will comprise an integrated care board (ICB) and integrated care partnership (ICP). Integrated care boards will take on the commissioning roles and responsibilities of CCGs (or delegate them e.g. to provider collaboratives) and are likely to absorb some planning roles from NHS England. Integrated care partnerships will bring together a wide range of stakeholders (inc. VCSE organisations) to develop an integrated care strategy that will underpin the work of each ICB and describe how NHS services will meet local needs.
For many charities, these structural changes and the supposed ‘joining up’ of health and care services across systems, places, and neighbourhoods will change how their services are commissioned and their place in the wider health and social care landscape. There is lots for charities to get to grips with, such as reshaping their data to align with emerging boundaries. However, the current period of flux and shift to ICSs presents opportunities for charities to use data and data visualisations to broker relationships, influence priorities and legitimise their knowledge. There are two main reasons to believe this:
- A true systems approach to health and social care necessitates VCSE involvement
VCSE organisations not only provide specialist services but often work collaboratively across the three scales that ICSs are expected to cover. ICBs are expected to have agreements in place for engaging with VCSE organisations by the time they formalise, although this could take place through engagement with broader VCSE alliances.
The Health and Care Bill makes it clear that when preparing an integrated care strategy, the ICP must involve local Healthwatch organisations and people who live or work within that area. This wholesale adoption of place as a central organising concept means the knowledge and work of VCSE organisations should be highly sought after, even if they are, at the least, used as a proxy for engaging communities. - The health data rush has begun
I wouldn’t go as far as saying that data saves lives, but there’s definitely room for greater use of data and digital tools in health and social care. Data and digital tools sit prominently in most major health and care developments, such as the NHS Long Term Plan and manifest in initiatives such as the What Good Looks Like framework. For ICSs, an increased focus on preventative population health management and focus on spatial inequalities in their integrated care strategies will place increased demands on data gathered in Joint Strategic Needs Assessments (JSNAs).
Except, when I first looked at JSNAs in 2017, I found lots to be out of date and presented in static PDFs that hindered access to underlying datasets. A brief review of JSNAs (including the more innovative ‘dynamic’ resources I studied) shows that the situation hasn’t changed, and although there are some great examples of current and interactive JSNAs (such as Healthy Suffolk), lots of JSNAs are not in a position to properly inform integrated care strategies.
This isn’t to be read as a criticism of public health teams, as it’s no surprise that health intelligence was an early victim of heavy cuts to public health expenditure. However, it leaves plenty of space for charities to use data visualisations to inform strategies, build relations and become ‘prosumers’ of health data.
Using data in acts of visual brokerage
Data visualisations not only inform and persuade but can act as brokers between individuals and communities. From my own research, and that of others, we see how charities use data visualisations to communicate information but also to build relationships and gain legitimacy in new spaces. Visual representations are processed quickly by our brains and come loaded with claims of truth and expertise.
As charities seek to embed themselves in the changing health and social care landscape, a simple visualisation of their own data or third-party data could provide a starting point for new engagements. For example, a charity may simply choose to aggregate postcodes of their service users or grantees by local authority or against the IMD to make the case that an ICS or provider collaborative should engage with them.
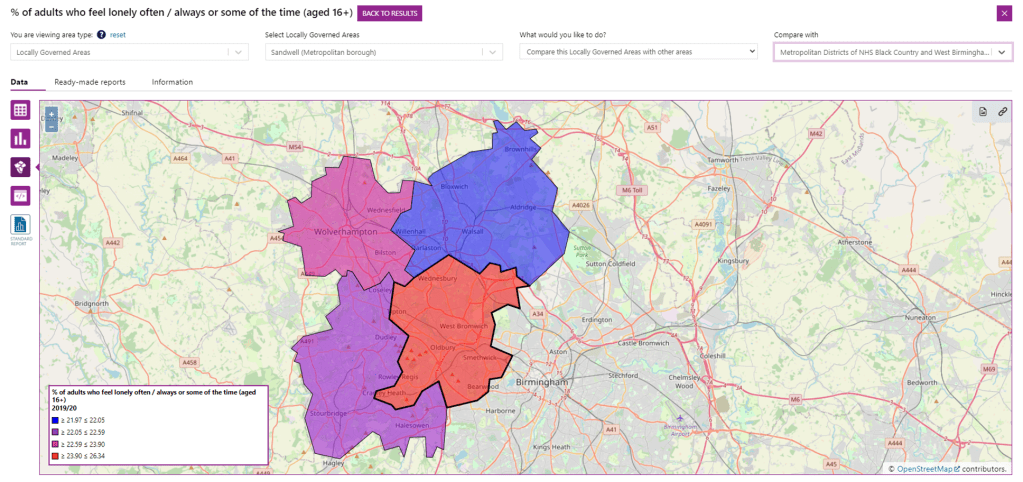
I’ve written before about how useful Local Insight can be, but there are some great free resources that can be used to start conversations and influence the direction of travel. For example, a charity working to reduce loneliness in the West Midlands might use LG Inform to demonstrate why Sandwell should be a priority area of concern, alongside the services they offer. PHE’s Health Inequalities dashboard is another great tool that may be used.
Charities as ‘prosumers’ of health data
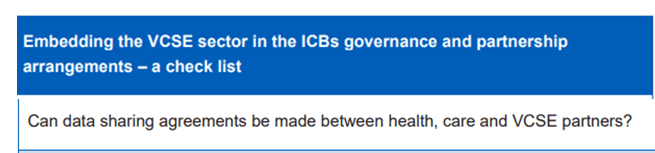
The NHS Long Term Plan and the Data Saves Lives policy paper make strong commitments, possibly even a statutory imperative, to create an environment in which health data can be easily shared between partner organisations. The NHS England ICS – VCSE guidance encourages data sharing agreements to be in place between partner organisations.
Although there are numerous challenges to the sharing of health data, it seems the ambition to do so is there. This offers charities the chance to become ‘prosumers’ of health data; not only can they produce data to build relationships and legitimise knowledge, but they can consume external data, analyse it according to their area of concern, possibly combine it with their own data, and then reshare it with partner organisations. This is made easier within dynamic and interactive data environments, where data exploration is intuitive and customisable.
Even at its most basic level, prosumption may look like combining anonymised health data with spreadsheet survey data collected by the charity to add insight and depth. The point here isn’t the complexity of analysis, but rather using data as a way of embedding the organisation further in the health and care system by adding value and bringing depth of insight. There has been great concern that more flexible procurement practices will lead to greater private sector involvement. Whilst there’s no doubt that private sector organisations (such as the data behemoth IQVIA) will be desperate to embed themselves as key data partners, they can’t provide the specialist insight and ‘ground truth’ knowledge that charities can bring to the table.
Good data sources:
LG Inform
PHE’s Health Inequalities Dashboard
Fingertips
Data vis doesn’t need to be complicated, and for inspiration, take a look at Ollie Carrington’s collection of charity data vis on Flickr.
Further reading:
List of ICSs
King’s Fund guidance (as always, amazing work). The cover photo for this post is from the King’s Fund, here.
NHS ICS Guidance
Health Tech Newspaper is worth a read
Dave Beer writes about prosumption in Popular Culture and New Media
Visual brokerage was introduced by William Allen, although I’ve used it in a slightly different way
